Cosmic energies and mankind: graphs for reflection - Страница 6
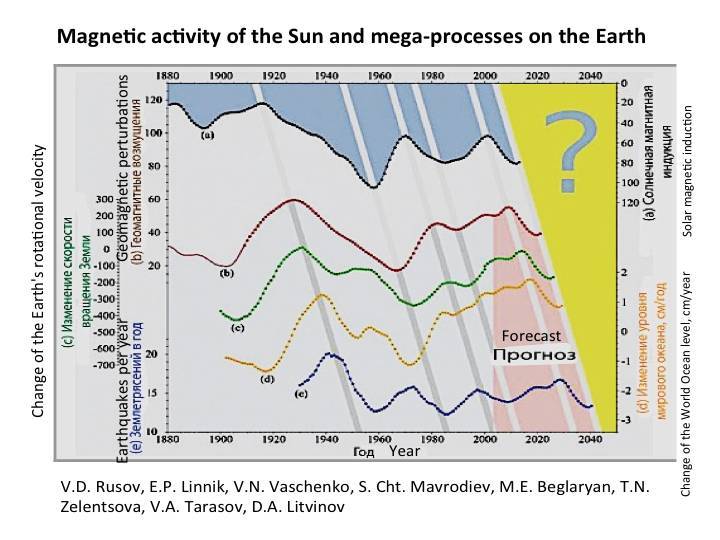
There is a relationship, a correspondence, but it is shifted in time.
What relationship is there between the cereal yield in the world and the intensity of the Earth's magnetic field? To learn this, let us take the data of space monitoring of the magnetic field intensity in various regions of the Earth.
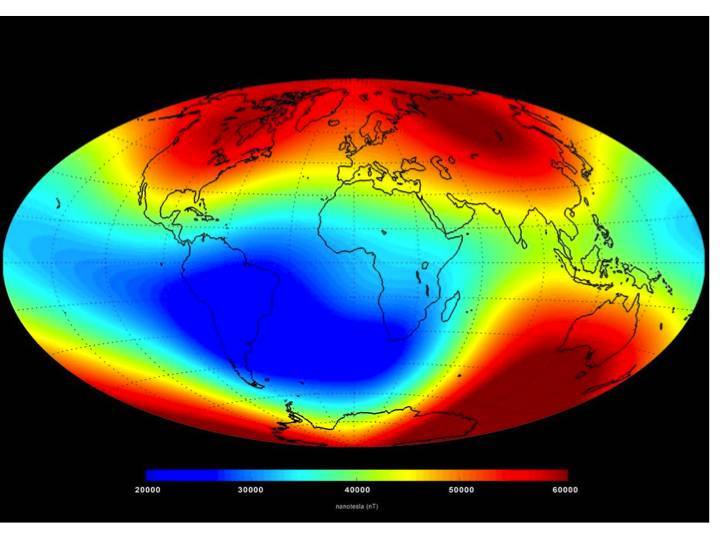
Swarm reveals Earth’s changing magnetism, ESA, 19 June 2014, http://www.esa.int/Our_Activities/Observing_the_Earth/Swarm/Swarm_reveals_Earth_s_changing_magnetism
We will also present a graph of the change in the Earth's rotational velocity on the day when the data of its magnetic field were obtained.
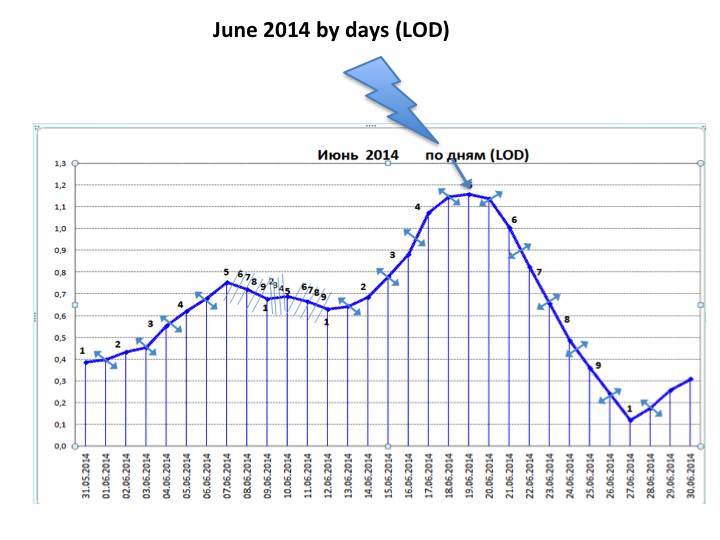
It can be seen that the intensity of the magnetic field over North America is higher than over Arab countries. Then maybe this is the reason why we have a difference in cereal growth rates?
We will recheck this by comparing cereal growth in the world (matches cereal growth in the USA) with the growth in Argentina and Brazil where the magnetic field intensity is much lower.
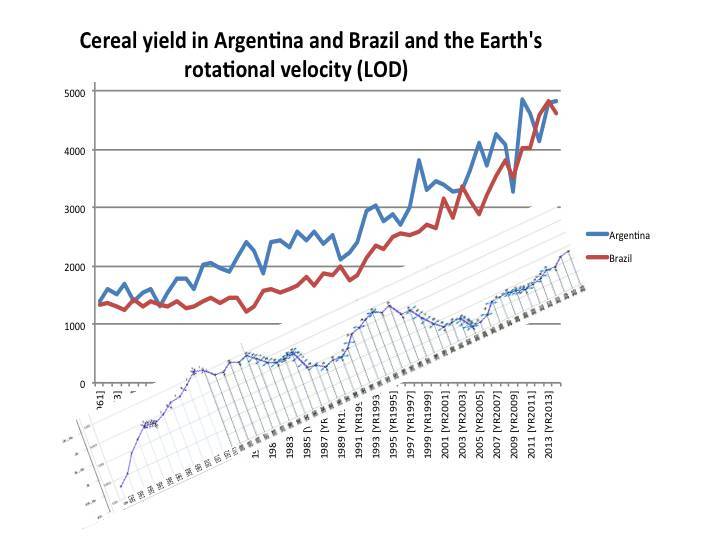
Let us compare it with cereal yield in the USA.

Yes, the trends of yield growth by years are relatively opposite. Although growth prevails in all countries. And correlation between these data is positive. Whereas each year fluctuations, deviations from mean values, anomalies are relatively opposite.
The greatest differences in fluctuation rates occur in the late 80s, early 90s. The smallest differences occur in 1961 and 2013. 2013 is the time of polarity reversal of the solar magnetic field. This process is prolonged, it takes more than a year. But exactly in 2013 there were the greatest changes of the solar magnetic fields on its poles. The North Pole became positive. These years, there is the smallest difference in cereals growth between the USA and Arab countries. According to our data, in 2013 the difference in EEG frequencies of the subjects also decreased. GDP growth rates of various countries became less variable than they were before.
How did trees usually grow in Argentina, Brazil and the USA?
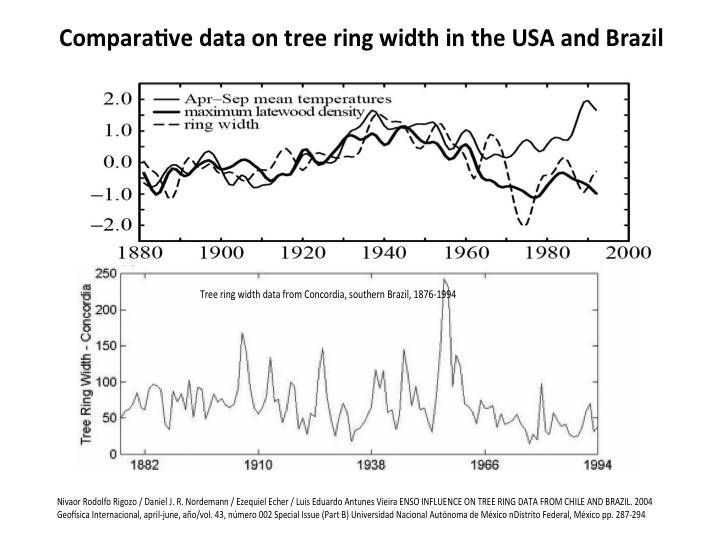
The trees have relatively opposite indicators, the same as in the case of cereals. At the same time, one must take into account the difference in temperature and climate between these countries.
Let us compare these graphs with the Earth's rotational velocity.

There is the relationship between the tree growth rates and the Earth's rotational velocity: tree growth in Brazil is higher with at the slowdown of rotational velocity. In the USA trees grow better at the growth of the Earth's rotational velocity.
Yes, trees in the USA and Brazil, like cereals, grow with relatively opposite trends with respect to the Earth's rotational velocity.
So what, is the reason in the Earth's magnetic field?
Most likely this is a superposition of many factors, including genetic ones. This conclusion is based upon the analysis of high-yielding breeds of cows that were kept on the same farm. Milk yields there varied depending on the Earth's magnetic field intensity in the region where they were. They were located in one place, but their genetics was different. The statistics is impressive – more than a thousand cows of each breed.
See V.A. Afanasiev, S.M. Chibisov, A.A. Nikishov, A.Yu. Shitikov. Productivity of high-yielding cows of black-motley and red breeds at various helio-geomagnetic activity.
One of the conclusions of this study:
"Highly productive animals, obviously, possess more stable metabolism than average over the herd. Therefore, they, apparently, were less exposed to the influence of the Sun, but were more sensitive to the Earth's magnetic field intensity".
The most important final conclusions of this study are the following:
"1. The experiment revealed a strong relationship between the provided… indicators of annual average productivity and annual average geomagnetic activity data (Ar – index).
2. A negative value of r = from -0.37 to -0.74 was determined at p ≥ 0.95, the relationship between the provided productivity of red breed animals and geomagnetic activity, which can be interpreted as a trend of decreasing productivity at the increase of geomagnetic activity, except 3-4 years close to the change of solar magnetic poles, i.e. the years of maximum solar activity.
3. The correlation between the adjusted productivity of black-motley breed and geomagnetic activity is positive with r = from 0.53 to 0.74 at p ≥ 0.975, which can be interpreted as a trend of increasing productivity at the increase of geomagnetic activity.
4. No valid correlation was observed between the solar activity and the yield of high-yielding cows of black-motley and red breeds".
Different breeds react differently to the geomagnetic situation and the Earth's rotational velocity. Here is one of the graphs of that study.

The authors discovered a special asynchrony of milk yields in the period "when the solar magnetic poles reversal takes place. In 1969, on the Northern part of the Sun, the South pole S turned to the North one N, whereas in 1980 the North pole N turned to S. Exactly during these years the greatest asynchrony of the curves takes place".
Intensity of the northern and southern magnetic poles on the Sun has a statistical relationship with the growth of tree rings of different clusters.

The difference in the ring width growth rate among clusters is higher at the greater difference in intensity of the northern and southern solar magnetic poles.
However, one should not reduce everything to the Earth's magnetic field or rotational velocity. These are mega-factors. They also affect the regional factors that influence the growth of plants. The methodology of cause-effect relationships lies in the graph of dependency of main mega-processes on the Earth on the solar magnetic activity. It includes the shift of mega-processes in time. The graph below reflects a close cause-effect relationship between the Earth's rotational velocity, the availability of optimal groundwater level and the tree growth.

In different localities, depending on the magnetic and other energies, water and its magnetic and other properties change qualitatively. This is connected with the development of biota in this region (see S.Yu. Kuznetsova). Magnetic properties of water // Advances in modern natural science. – 2010. – № 10. – pp. 49-51; URL: https://www.natural-sciences.com/en/article/view?id=9082.